SOUTH (area 100-110-120-130-300-310-320-330-340-350-360)
|
Single Family Homes
June 2026 Average Sold Price per Square Footage was Appreciating**
|
|
|
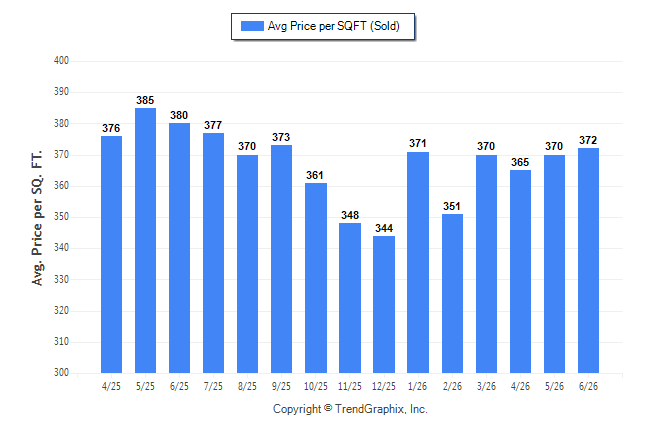
Curnt vs. Prev Month: Avg. Sq. Ft. Price (Sold)  0.5%
0.5%
Curnt vs. Same Month 1 Yr Ago: Avg. Sq. Ft. Price (Sold)  -2.1%
-2.1%
* Information and statistics derived from Northwest Multiple Listing Service.