|
|
Published January 2024*
| Location: |
Area 5300 |
| Price Range: |
$700,000 - No Limit |
| SQFT Range: |
0 - No Limit |
| Property Types: |
Residential - Single Family Homes and Condo/Coop/Villa/Twnhse Combined - All Properties - All Properties - All Properties |
| Bedrooms: |
0 - No Limit |
| Full Baths: |
0 - No Limit |
| Half Baths: |
0 - No Limit |
| Year Built: |
0 - No Limit |
|
 Prepared for you by: Laura Cole & Tana Gaskill Prepared for you by: Laura Cole & Tana Gaskill
|
|
Number of Homes For Sale vs. Sold vs. Pended (Oct. 2022 - Dec. 2023)
|
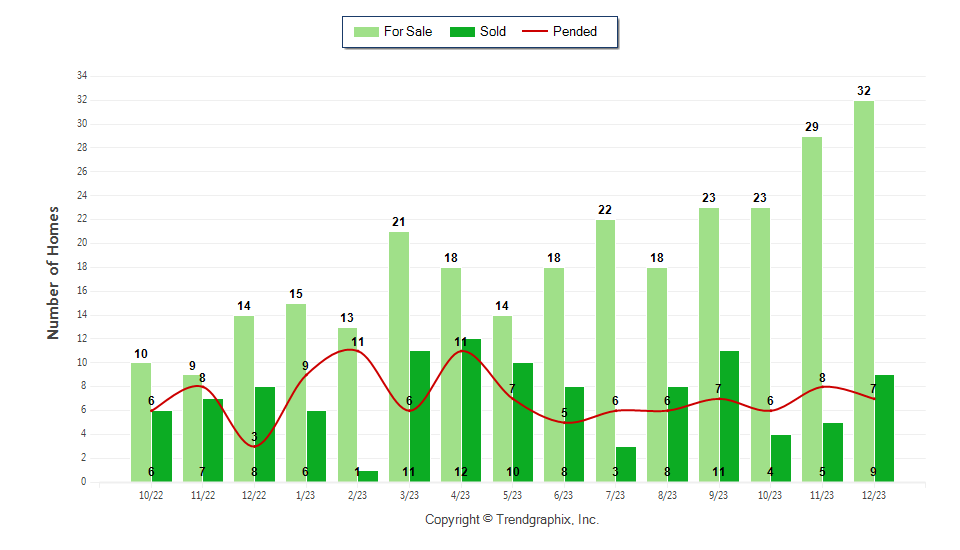
| Curnt vs. Prev Month | Curnt vs. Same Month 1 Yr Ago | Curnt vs. Same Qtr 1 Yr Ago | | Dec. 23 | Nov. 23 | % Change | Dec. 23 | Dec. 22 | % Change | Oct. 23 to Dec. 23 | Oct. 22 to Dec. 22 | % Change | | For Sale | 32 | 29 | 10.3%  | 32 | 14 | 128.6% | 32 | 14 | 128.6% | | Sold | 9 | 5 | 80% | 9 | 8 | 12.5% | 18 | 21 | -14.3%  | | Pended | 7 | 8 | -12.5% | 7 | 3 | 133.3% | 21 | 17 | 23.5% |
| TODAY’S STATS | | Current vs. Prev MTD | Current vs. Same MTD 1 Yr Ago | Current vs. Prev YTD | | 1/1/24 - 1/26/24 | 12/1/23 - 12/26/23 | % Change | 1/1/24 - 1/26/24 | 1/1/23 - 1/26/23 | % Change | 1/1/24 - 1/26/24 | 1/1/23 - 1/26/23 | % Change | | For Sale | 28 | 33 | -15.2% | 28 | 15 | 86.7% | 28 | 15 | 86.7% | | Sold | 3 | 7 | -57.1% | 3 | 5 | -40% | 3 | 5 | -40% | | Pended | 9 | 5 | 80% | 9 | 6 | 50% | 9 | 6 | 50% |
December 2023 was a Neutral market**
Home For Sale in December 2023 was 32 units. It was up 10.3% compared to last month and up 128.6% compared to last year.
Home Closed in December 2023 was 9 units. It was up 80% compared to last month and up 12.5% compared to last year.
Home Placed under Contract in December 2023 was 7 units. It was down 12.5% compared to last month and up 133.3% compared to last year.
**Buyer's market: more than 6 months of inventory based on closed sales. Seller's market: less than 3 months of inventory based on closed sales. Neutral market: 3 - 6 months of inventory based on closed sales.
|
|
Average Price per SQFT (Sold) (Oct. 2022 - Dec. 2023)
|
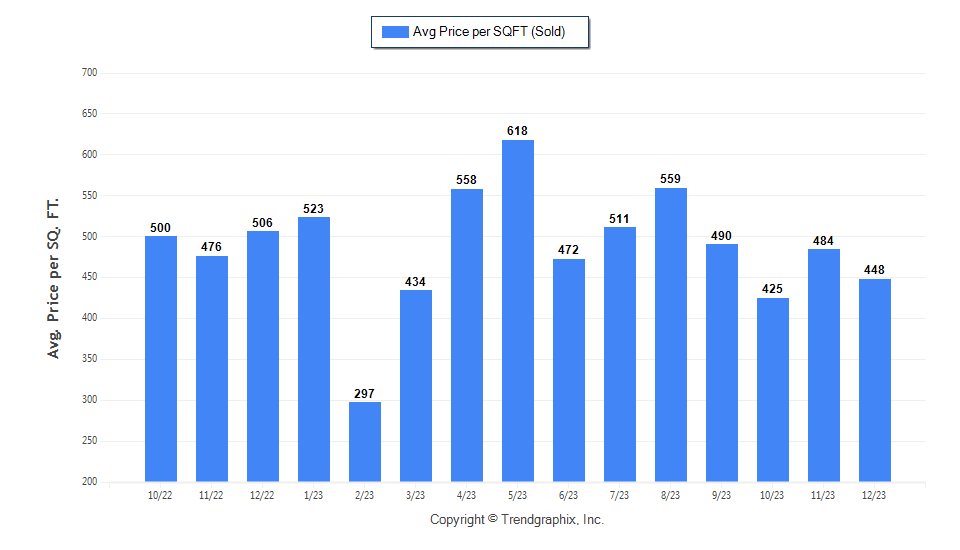
| Curnt vs. Prev Month | Curnt vs. Same Month 1 Yr Ago | Curnt vs. Same Qtr 1 Yr Ago | | Dec. 23 | Nov. 23 | % Change | Dec. 23 | Dec. 22 | % Change | Oct. 23 to Dec. 23 | Oct. 22 to Dec. 22 | % Change | | Avg. Sq. Ft. Price (Sold) | 448 | 484 | -7.4% | 448 | 506 | -11.5% | 453 | 494 | -8.3% |
| TODAY’S STATS | | Current vs. Prev MTD | Current vs. Same MTD 1 Yr Ago | Current vs. Prev YTD | | 1/1/24 - 1/26/24 | 12/1/23 - 12/26/23 | % Change | 1/1/24 - 1/26/24 | 1/1/23 - 1/26/23 | % Change | 1/1/24 - 1/26/24 | 1/1/23 - 1/26/23 | % Change | | Avg. Sq. Ft. Price (Sold) | 665 | 439 | 51.5% | 665 | 524 | 26.9% | 665 | 524 | 26.9% |
December 2023 Average Sold Price per Square Footage was Neutral**
Average Sold Price per Square Footage in December 2023 was $448. It was down 7.4% compared to last month and down 11.5% compared to last year.
**Based on 6 month trend - Appreciating/Depreciating/Neutral.
|
|
Avg Days On Market & SP/Orig LP % (Oct. 2022 - Dec. 2023)
|
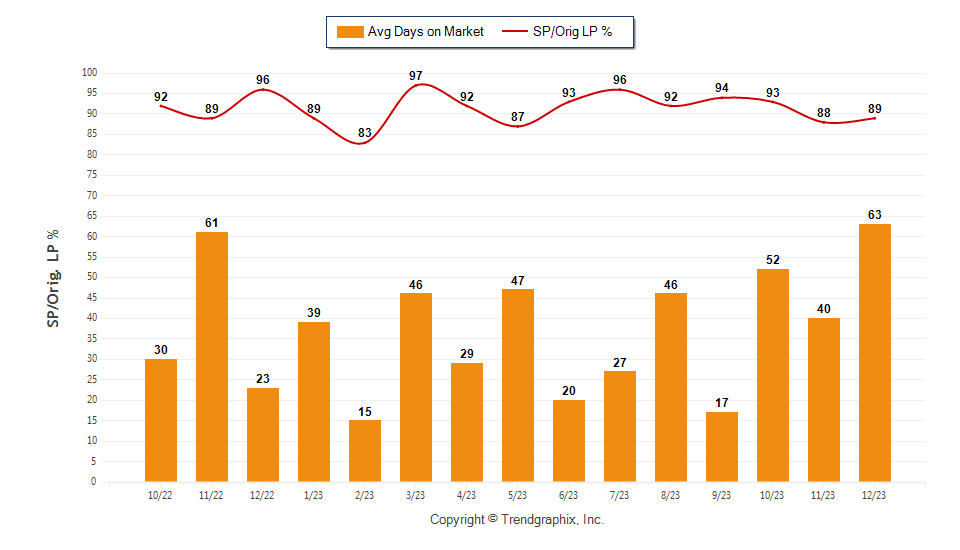
| Curnt vs. Prev Month | Curnt vs. Same Month 1 Yr Ago | Curnt vs. Same Qtr 1 Yr Ago | | Dec. 23 | Nov. 23 | % Change | Dec. 23 | Dec. 22 | % Change | Oct. 23 to Dec. 23 | Oct. 22 to Dec. 22 | % Change | | Avg Days on Market | 63 | 40 | 57.5% | 63 | 23 | 173.9% | 54 | 38 | 42.1% | | Sold/Orig LP Diff. % | 89 | 88 | 1.1% | 89 | 96 | -7.3% | 90 | 93 | -3.2% |
| TODAY’S STATS | | Current vs. Prev MTD | Current vs. Same MTD 1 Yr Ago | Current vs. Prev YTD | | 1/1/24 - 1/26/24 | 12/1/23 - 12/26/23 | % Change | 1/1/24 - 1/26/24 | 1/1/23 - 1/26/23 | % Change | 1/1/24 - 1/26/24 | 1/1/23 - 1/26/23 | % Change | | Avg Days on Market | 21 | 61 | -65.6% | 21 | 26 | -19.2% | 21 | 26 | -19.2% | | Sold/Orig LP Diff. % | 92 | 91 | 1.1% | 92 | 92 | 0% | 92 | 92 | 0% |
December 2023 Average Days on Market trend was Rising**
Average Days on Market in December 2023 was 63. It was up 57.5% compared to last month and up 173.9% compared to last year.
December 2023 Sold/Original List Price Ratio Remains Steady**
Sold/Original List Price % in December 2023 was 89%. It was up 1.1% compared to last month and down 7.3% compared to last year.
**Based on 6 month trend - Rising/Falling/Remains Steady.
|
|
Average Price of For Sale and Sold (Oct. 2022 - Dec. 2023)
|
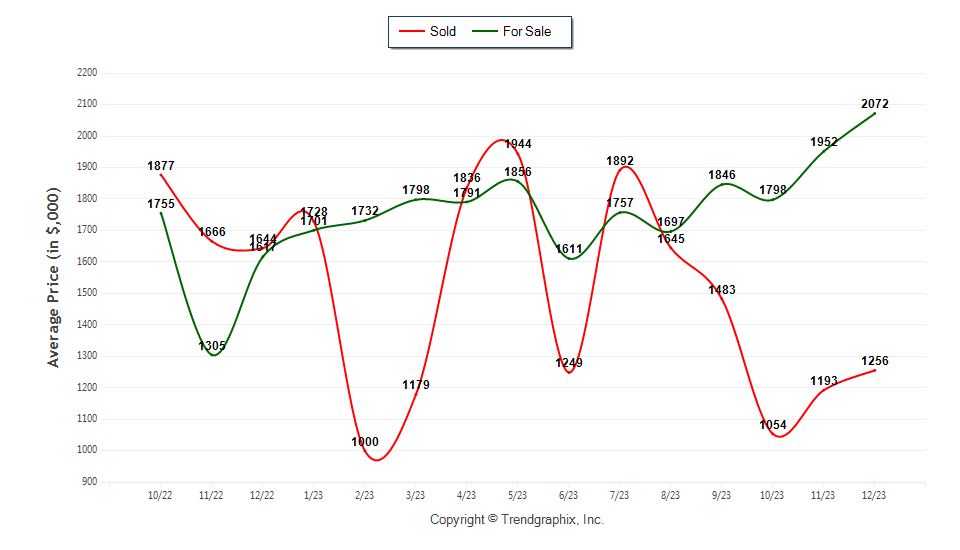
| Curnt vs. Prev Month | Curnt vs. Same Month 1 Yr Ago | Curnt vs. Same Qtr 1 Yr Ago | | Dec. 23 | Nov. 23 | % Change | Dec. 23 | Dec. 22 | % Change | Oct. 23 to Dec. 23 | Oct. 22 to Dec. 22 | % Change | | Avg. Active Price | 2,072 | 1,952 | 6.1% | 2,072 | 1,617 | 28.1% | 1,956 | 1,574 | 24.3% | | Avg. Sold Price | 1,256 | 1,193 | 5.3% | 1,256 | 1,644 | -23.6% | 1,194 | 1,718 | -30.5% |
| TODAY’S STATS | | Current vs. Prev MTD | Current vs. Same MTD 1 Yr Ago | Current vs. Prev YTD | | 1/1/24 - 1/26/24 | 12/1/23 - 12/26/23 | % Change | 1/1/24 - 1/26/24 | 1/1/23 - 1/26/23 | % Change | 1/1/24 - 1/26/24 | 1/1/23 - 1/26/23 | % Change | | Avg. Active Price | 1,955 | 2,069 | -5.5% | 1,955 | 1,701 | 14.9% | 1,955 | 1,701 | 14.9% | | Avg. Sold Price | 2,717 | 1,266 | 114.6% | 2,717 | 1,673 | 62.4% | 2,717 | 1,673 | 62.4% |
December 2023 Average For Sale Price was Appreciating**
Average For Sale Price (in thousand) in December 2023 was $2072. It was up 6.1% compared to last month and up 28.1% compared to last year.
December 2023 Average Sold Price was Neutral**
Average Sold Price (in thousand) in December 2023 was $1256. It was up 5.3% compared to last month and down 23.6% compared to last year.
**Based on 6 month trend - Appreciating/Depreciating/Neutral.
|
|
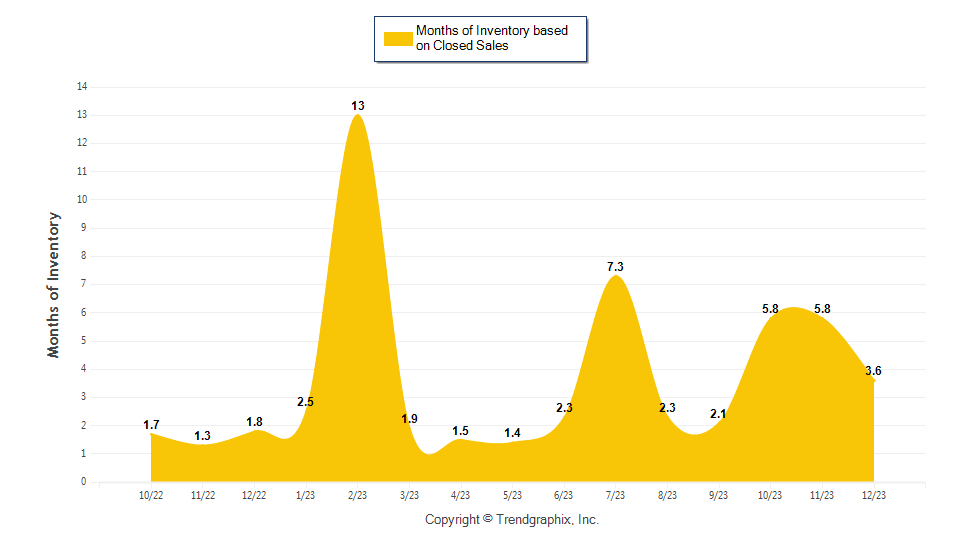
Months of Inventory Based on Closed Sales (Oct. 2022 - Dec. 2023)
|
| Curnt vs. Prev Month | Curnt vs. Same Month 1 Yr Ago | Curnt vs. Same Qtr 1 Yr Ago | | Dec. 23 | Nov. 23 | % Change | Dec. 23 | Dec. 22 | % Change | Oct. 23 to Dec. 23 | Oct. 22 to Dec. 22 | % Change | | Months of Inventory (Closed Sales) | 3.6 | 5.8 | -37.9% | 3.6 | 1.8 | 102.9% | 5.3 | 2 | 165% |
| TODAY’S STATS | | Current vs. Prev MTD | Current vs. Same MTD 1 Yr Ago | Current vs. Prev YTD | | 1/1/24 - 1/26/24 | 12/1/23 - 12/26/23 | % Change | 1/1/24 - 1/26/24 | 1/1/23 - 1/26/23 | % Change | 1/1/24 - 1/26/24 | 1/1/23 - 1/26/23 | % Change | | Months of Inventory (Closed Sales) | 7.8 | 4 | 96.1% | 7.8 | 2.5 | 210.6% | 7.8 | 2.5 | 210.6% |
December 2023 was a Neutral market**
Months of Inventory based on Closed Sales in December 2023 was 3.6. It was down 37.9% compared to last month and up 102.9% compared to last year.
**Buyer's market: more than 6 months of inventory based on closed sales. Seller's market: less than 3 months of inventory based on closed sales. Neutral market: 3 - 6 months of inventory based on closed sales.
|
| Date | 10/22 | 11/22 | 12/22 | 1/23 | 2/23 | 3/23 | 4/23 | 5/23 | 6/23 | 7/23 | 8/23 | 9/23 | 10/23 | 11/23 | 12/23 | | For Sale | 10 | 9 | 14 | 15 | 13 | 21 | 18 | 14 | 18 | 22 | 18 | 23 | 23 | 29 | 32 | | New Listing | 5 | 7 | 7 | 9 | 12 | 14 | 9 | 7 | 9 | 13 | 7 | 12 | 12 | 17 | 8 | | Sold | 6 | 7 | 8 | 6 | 1 | 11 | 12 | 10 | 8 | 3 | 8 | 11 | 4 | 5 | 9 | | Pended | 6 | 8 | 3 | 9 | 11 | 6 | 11 | 7 | 5 | 6 | 6 | 7 | 6 | 8 | 7 | | Months of Inventory (Closed Sales) | 1.7 | 1.3 | 1.8 | 2.5 | 13 | 1.9 | 1.5 | 1.4 | 2.3 | 7.3 | 2.3 | 2.1 | 5.8 | 5.8 | 3.6 | | Months of Inventory (Pended Sales) | 1.7 | 1.1 | 4.7 | 1.7 | 1.2 | 3.5 | 1.6 | 2 | 3.6 | 3.7 | 3 | 3.3 | 3.8 | 3.6 | 4.6 | | Absorption Rate (Closed Sales) % | 60 | 77.8 | 57.1 | 40 | 7.7 | 52.4 | 66.7 | 71.4 | 44.4 | 13.6 | 44.4 | 47.8 | 17.4 | 17.2 | 28.1 | | Absorption Rate (Pended Sales) % | 60 | 88.9 | 21.4 | 60 | 84.6 | 28.6 | 61.1 | 50 | 27.8 | 27.3 | 33.3 | 30.4 | 26.1 | 27.6 | 21.9 | | Avg. Active Price | 1,755 | 1,305 | 1,617 | 1,701 | 1,732 | 1,798 | 1,791 | 1,856 | 1,611 | 1,757 | 1,697 | 1,846 | 1,798 | 1,952 | 2,072 | | Avg. Sold Price | 1,877 | 1,666 | 1,644 | 1,728 | 1,000 | 1,179 | 1,836 | 1,944 | 1,249 | 1,892 | 1,645 | 1,483 | 1,054 | 1,193 | 1,256 | | Avg. Sq. Ft. Price (Sold) | 500 | 476 | 506 | 523 | 297 | 434 | 558 | 618 | 472 | 511 | 559 | 490 | 425 | 484 | 448 | | Sold/List Diff. % | 93 | 96 | 97 | 94 | 83 | 99 | 93 | 90 | 98 | 96 | 96 | 95 | 94 | 89 | 93 | | Sold/Orig LP Diff. % | 92 | 89 | 96 | 89 | 83 | 97 | 92 | 87 | 93 | 96 | 92 | 94 | 93 | 88 | 89 | | Avg Days on Market | 30 | 61 | 23 | 39 | 15 | 46 | 29 | 47 | 20 | 27 | 46 | 17 | 52 | 40 | 63 | | Median Active Price | 1,575 | 1,100 | 1,300 | 1,750 | 1,800 | 1,495 | 1,722 | 1,685 | 1,472 | 1,400 | 1,475 | 1,400 | 1,600 | 1,649 | 1,600 | | Median Sold Price | 1,875 | 1,400 | 1,925 | 1,750 | 1,000 | 1,175 | 1,773 | 1,583 | 1,035 | 1,875 | 1,560 | 1,366 | 848 | 1,273 | 1,250 |
|
|
If your email program is not displaying the chart graphs properly, please click on the following link which will take you to a web page that contains the graphs: Show Chart
*All reports are published January 2024, based on data available at the end of December 2023, except for the today’s stats. This representation is based in whole or in part on data supplied by Realtor Association of The Palm Beaches, Jupiter, Tequesta, Hobe Sound Association of Realtors, and St. Lucie Association of Realtors. Neither the Board nor its MLS guarantees or Neither the Boards nor its MLS guarantees or is in any way responsibles for its accuracy. Data maintained by the Board or its MLSs may not reflect all real estate activity in the market. Report reflects activity by all brokers participated in the MLS.
|
|
|
|